Why All Business Central Customers NEED BC Power BI Applications
Insights Telemetry:
Getting Started with Telemetry
I have encountered so many weird error
messages over the last couple decades of working with Microsoft Dynamics software.
Sometimes these are configuration issues, sometimes apps or ISV issues, very rarely
Microsoft issues or any other issue you can imagine. One of the most frustrating
pieces is trying to determine why the error happened and what it means! Well,
the days of guessing for Dynamics 365 Business Central are over. Now
introducing Dynamics 365 Business Central telemetry.
Last year, I was preparing for my session
to present the Directions EMEA conference, when Kennie Pontoppidan with the
Business Central Microsoft team pinged me and asked me if I would incorporate Telemetry
into my presentation. At the time, I had no idea what Microsoft Teams and
Telemetry had in common, so I asked Kennie to sit down and explain it to me.
The answer was simple: What if I wanted to see if my customers and users were
actually using Microsoft Teams to view Business Central data (which they can do
for free) and I could see that through a Power BI Dashboard. This could all be
accomplished through Power BI Dashboards, connected to my own or my client’s
environments. My mind was blown.
I highly recommend you try it out today!
All the documentation on getting started can be found at: https://learn.microsoft.com/en-us/dynamics365/business-central/dev-itpro/administration/telemetry-enable-application-insights
or check out a step by step guide at: https://www.abccgroup.com/post/getting-started-with-dynamics-365-business-central-telemetry.
Here is a list of what Microsoft Telemetry can offer:
The Power BI Telemetry Power BI app consists of four reports:
·
Usage
·
Errors
·
Performance
·
Administration
The usage report

The usage report provides a multi-perspective view into how Business
central is being used. The report can have data from in one or more
environments or apps (depending on how you fill in the parameters and how
you've partitioned the Azure Application Insights resource).
What do the pages in the report show?
·
Sessions: See how sessions are distributed over a timeline, weekday, and
time of day
·
Clients: See which types of clients and browsers that users use
·
Locations: See where users sign in from and which languages they use in
the client
·
Page views: See which pages users use and when
·
Reports: See which reports users use and when
·
Feature usage: See which features users use and when
·
Integrations and Connectors: See the activity on system integrations (web
service calls)
·
Deprecated features: check if online environments are using deprecated
features such as basic authentication and need to migrate to better solutions
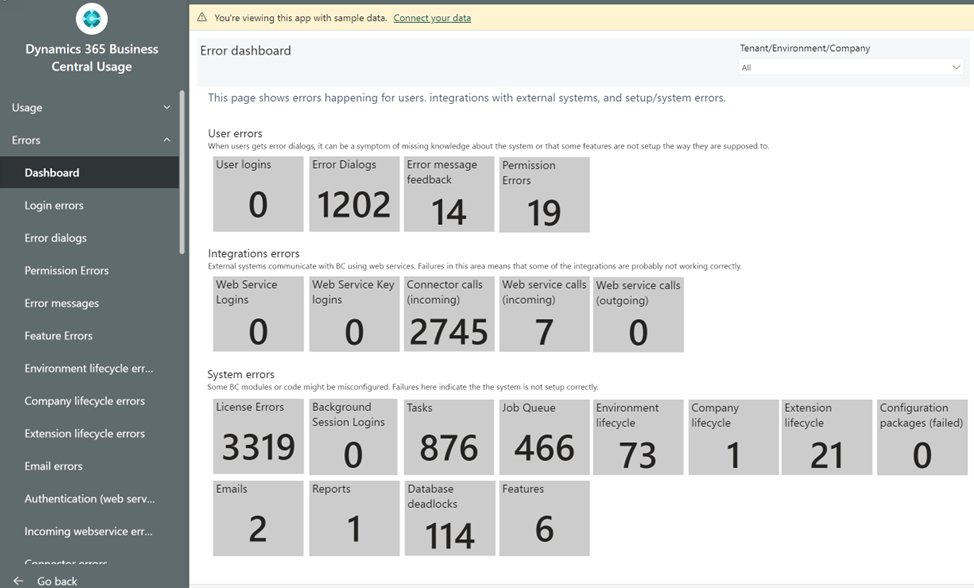
Error report
The error report provides a multi-perspective view into errors occurring
in one or more environments or apps (depending on how you fill in the parameters
and how you've partitioned the Azure Application Insights resource). The report
is a supplement to the Jupyter notebook trouble shooting guides (TSGs). Use the
report to investigate/slice'n'dice the data and the notebook to follow a
prescribed path.
What do the pages in the report show?
·
User errors: When users get error dialogs, it can be a symptom of missing
knowledge about the system, or that some features aren't set up the way they're
supposed to
·
Integrations errors: External systems communicate with Business Central
using web services. Failures in this area means that some of the integrations
are probably not working correctly
·
System errors: Some Business Central modules or code might be
misconfigured. Failures here indicate the system isn't set up correctly.
Performance report

The performance report provides a multi-perspective view into the
performance of one or more environments or apps (depending on how you fill in
the parameters and how you've partitioned the Azure Application Insights
resource). The report is a supplement to the Jupyter notebook trouble shooting
guides (TSGs). Use the report to investigate/slice'n'dice the data and the
notebook to follow a prescribed path.
What do the pages in the report show?
·
Sessions: Statistics on sessions that were started, client types (UI
clients, background, or web service), and user types (normal, admin, or guest)
·
OnCompanyOpen: Timings of the OnCompanyOpen trigger (is run every time a
session is created). Can show if expensive code was added here
·
Page views: Timings of pages visited by users, client type that ran them
(modern client or desktop), and browsers used
·
Reports: Timings of reports, client type that ran them (UI clients or
background), and reporting engine used (Word, RDLC, or processing only)
·
Long Running SQL Queries: Insights into SQL queries that ran longer than
750 milliseconds, the extensions and codeunits that called the database, and
corresponding AL call stacks
·
Database lock timeouts: Insights into SQL queries that waited for a lock
longer than 15 seconds, the extensions and codeunits that called the database,
and corresponding AL call stacks
·
Long Running AL methods: Insights into AL methods that ran longer than
10,000 milliseconds, the extensions and codeunits they belong to, and
corresponding AL call stacks
·
Incoming webservice calls/Outgoing webservice calls: Timings of
incoming/outgoing web service calls and their type (SOAP, OData, or API), http
status codes, and the codeunit they expose
·
Job Queue/Task scheduler: Timings of background jobs/tasks
·
Configuration packages: Timings of configuration package operations
·
App Updates: Timings of how long time updates of installed apps take
Administration report
The Administration report provides a multi-perspective view into the
current state of Business central environments and any change done to them.
What do the pages in the report show?
·
Inventory: See an inventory of environments and their current version
·
Update Planning: See an overview of environment versions and their update
schedules
·
All changes: See changes to environments, companies, extensions, and
indexes
·
Environment Changes: See changes to environments (for example,
stop/start, rename, copy, delete, update)
·
Company Changes: See changes to companies (for example, create, rename,
and delete)
·
Extension Changes: See changes to extensions (for example, install,
update, and uninstall)
·
Index Changes: See changes to indexes (keys) (added, removed)
·
Field Changes: See changes to fields that are tracked in the field
monitoring feature. Consider monitoring Business Central configuration tables
to have that data show up here
·
Retention Policy: See date deleted due to retention policies set up in
Business Central
Comments
Post a Comment